Enrolment Reports
The Enrolment Report shows your center's enrolment data two ways: a Charts view with summary cards and visual trends, and a History view with a paginated table of every enrolment that you can search, filter, and export.
How to Access
Open the Reports page
Click Reports in the sidebar navigation.
Click Enrollment Report
Select the Enrollment Report card from the reports hub.
Filters
Three filters at the top of the page apply to both tabs:
- Program — Defaults to All Programs. Pick a specific program to scope the charts and history.
- Classroom — Defaults to All Classrooms. When a program is selected, this list narrows to the classrooms in that program.
- Date range — Defaults to the last 12 months. Use the picker to set custom start and end dates, or pick a preset: Last 3 months, Last 6 months, Last 12 months.
Changing a filter refreshes the tab you're on right away, and updates the other tab the next time you switch to it.
Charts Tab
The Charts tab is the default view. It shows summary cards across the top and two charts below.
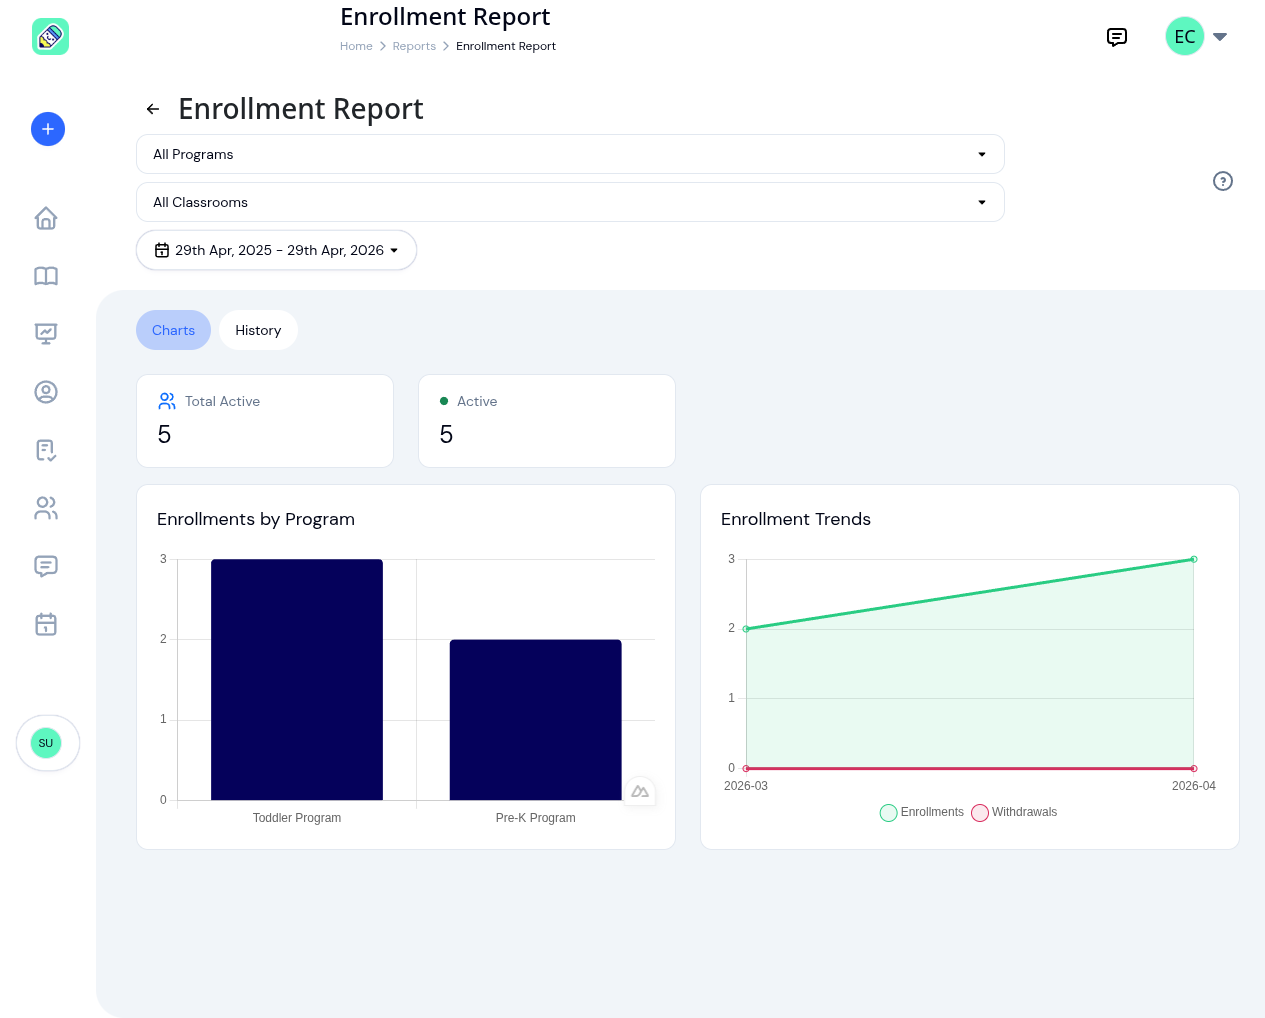
Summary Cards
- Total Active — Currently active enrolments across all programs (matches your filters)
- Status breakdown — One card per status that has at least one enrolment in the selected period: Active, Completed, Withdrawn, Draft
Each status card uses a color-coded dot: green for Active, gray for Completed, red for Withdrawn, yellow for Draft.
Enrollments by Program
A bar chart of how many children are enrolled in each program in the filtered period. Helps you see which programs are at capacity and where you have room.
Enrollment Trends
A line chart of monthly enrolment and withdrawal counts over the date range. Two lines are plotted:
- Enrollments (green) — New enrolments created each month
- Withdrawals (red) — Enrolments that ended each month
Use this to spot seasonal patterns and track whether your center is growing or shrinking.
History Tab
Switch to History to see every enrolment that matches your filters, one row per enrolment.
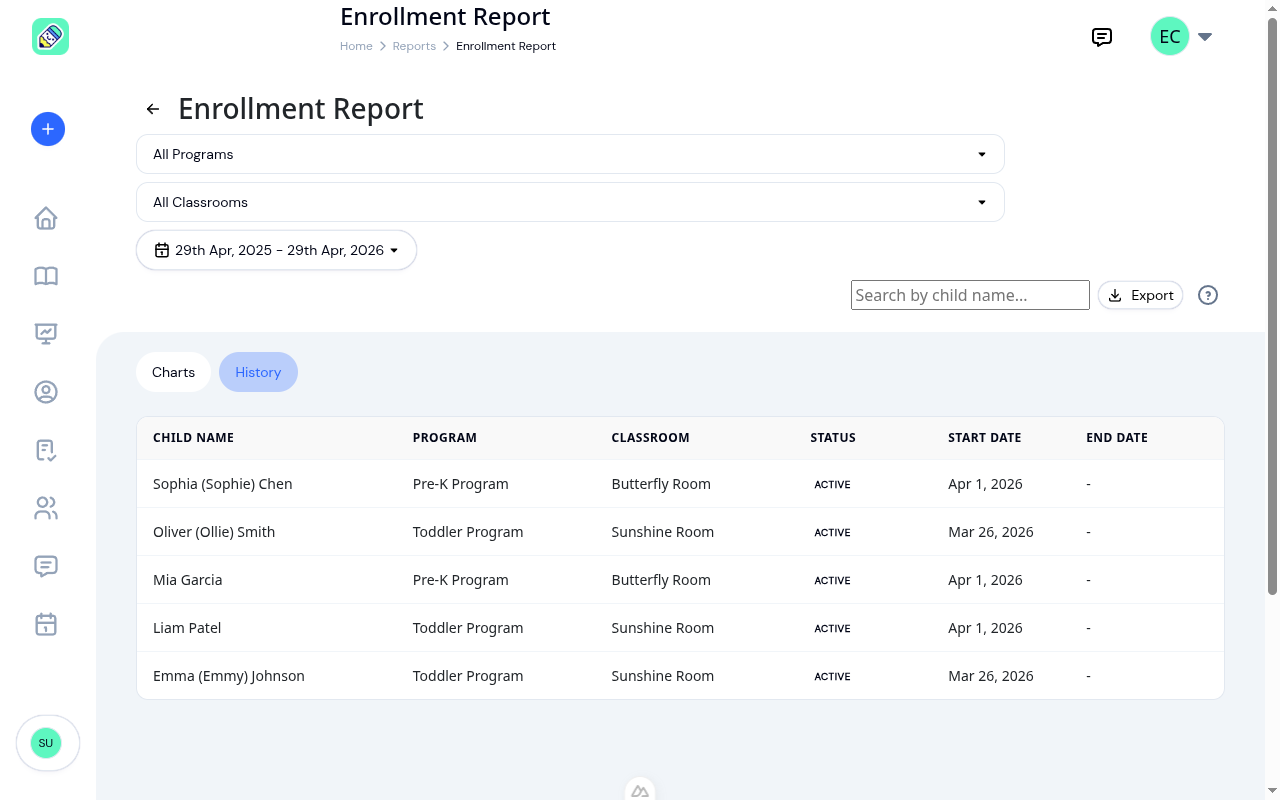
The table includes six columns:
- Child Name — Includes the preferred name in parentheses when set
- Program
- Classroom
- Status — Color-coded badge: Active (green), Completed (gray), Withdrawn (red), Draft (yellow)
- Start Date
- End Date — Dash when the enrolment is still open
Use the Search by child name field on the right to narrow the table further. Results update automatically a moment after you stop typing, so partial matches work without pressing Enter.
The table paginates at 20 records per page. Use the page controls below the table to move through long histories.
Exporting Data
From the History tab, click Export to download the filtered records:
- Export as Excel —
.xlsxspreadsheet - Export as CSV —
.csvfile - Export as PDF — Formatted PDF document
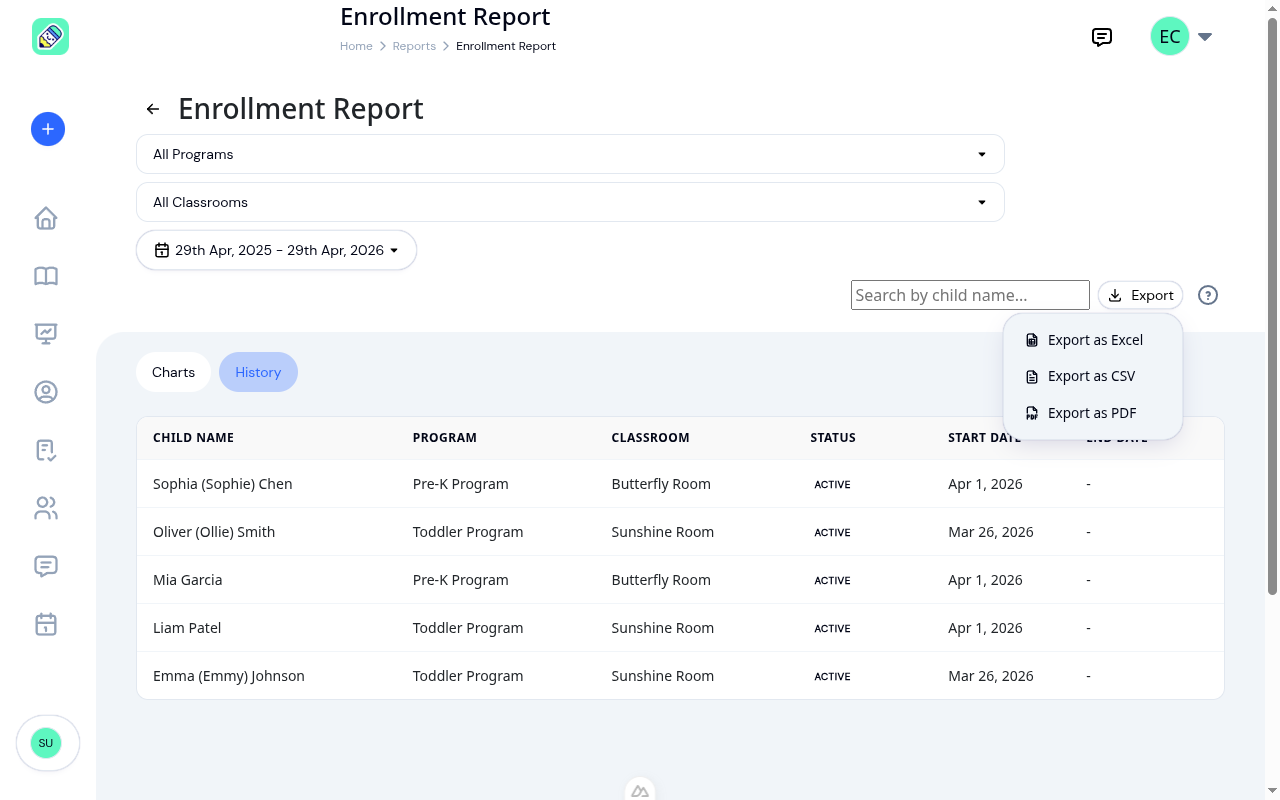
Each export respects every active filter (program, classroom, date range, search) — what you see in the table is what you get in the file.
Frequently Asked Questions
Yes. The program, classroom, and date range filters at the top apply to both tabs. The search field on the History tab is a separate filter that only affects the history table and exports.
Status cards only appear for statuses that have at least one enrolment in the filtered period. If every enrolment in your range is active, you'll see only the Total Active and Active cards.
An enrolment with the status set to Active. Future-dated enrolments may show a different status until their start date arrives.
Exports are capped at 10,000 records to keep them fast and small. If your range covers more than that, narrow the filters (e.g., one program at a time, or shorter date range) and run multiple exports.